
Abstract
This paper attempts a socio-economic analysis of elite institutions in India and uses employment options exercised by fresh graduates as a key indicator. We point to its implications to national objectives and development outcomes. We use IIT Bombay as a representative institution and analyse the employment data for the year 2013. Our analysis shows that most graduates of IIT Bombay do not choose jobs which directly benefit the Indian economy, nor do they prefer to work in Engineering and Technology. Merit, defined as performance at entrance examinations, rather than training, is a more decisive indicator of salaries and allocations. We argue that the definition of merit and its identification in a global economy is fraught with risk for a developing society such as ours. Finally, we make some recommendations on the way ahead and suggest a more strategic and developmental role for elite institutions.
Historically speaking, the modern university is perhaps the single most important social innovation which contributed to the overall development of modern societies. It has served as both the repository of knowledge and practices of a society and also as a trainer of its state, economic and cultural agents (Brezis and Courzet, 2004). The role of the elite university is even more crucial for it is here that the best of the state, civil society and industry converge to apprehend new challenges and to prepare for them. It is here that new practices, new professions and innovations emerge which help society make the required transition. This is the basis of the inordinate influence that elite institutions have on the culture and vision of a society.
Elite institutions of higher education and research have assumed significant importance in post-independence India. These span many areas of knowledge, ranging from engineering (the IITs), management (IIMs), physical sciences (IISc and the recently formed IISERs) to the social sciences (JNU, DSE).1 All these institutions have prided themselves on their autonomy, research atmosphere, a transparent and competitive admission procedure, a focus on excellence and on global standing.2 While these institutions and their graduates have flourished, there is a vast majority of educational institutions whose research output is of dubious quality, and whose graduates are frequently found “unemployable” (see Aspiring Minds, 2011 for a survey of suitability of engineers for information technology (IT) jobs, and also Chapter 5 of the World Bank Report, 2012). Thus we see a sharp distinction and wide chasm between the elite universities and their not-so-elite cousins.
The elite universities, though funded generously by the Govt. of India (GoI), form a miniscule fraction of the overall budget of the Ministry of Human Resource Development (MHRD). It is however the intellectual space over which these institutions have an almost total monopoly. 3 In engineering and physical sciences, they administer the key admission tests of JEE, JAM and GATE4 and key scholarship programs such as the Kishore Vaigyan- ik Puraskar Yojana (KVPY). Indeed, the IIT student is the role model for most students preparing for higher education in India. The World Bank funded TEQIP-II project talks of the “gap” between the IITs and other engineering colleges and of actions to close this gap. Faculty members from these institutions are on most selection and award committees and control much of the research funding. They also serve on expert committees advising the government on policy and programs, see for example, the memberships of the Scientific Advisory Council to the Prime Minister, or the Science and Engineering Research Board, among others.
Given their substantial influence in the conduct of higher education policy and practice, it is but natural that their contributions be analysed, both in research and in training. Clearly, the graduate of an educational institution is its primary output and the student, its primary resource in the conduct of research. Thus, the career choices of these students when they graduate, forms an important outcome for the institution, and for society itself. In this paper, we analyse campus placements, i.e., job allocations of fresh graduates, for the graduating batch of 2013 at IIT Bombay (IITB). Based on the outcomes of this analysis, we offer a perspective on possible connections between this and the economic and development outcomes in India.
Our analysis shows that most graduates of IITB do not choose jobs, which directly benefit the Indian economy, nor are they in the field of engineering and technology (ET). Many choose to work for global companies and/or for global markets and largely in the service sector. These global service companies pay substantially higher than core ET companies and are largely oblivious to the training that these students have received. One important contribution of this paper is to show that this allocation (or misallocation) is systematic and that excessive selectivity of the JEE and GATE exams forms an important basis for this. Another likely cause is the irrelevance of elite engineering education to current engineering needs and practices and thus an inability of its graduates to deliver value and command higher salaries.
On the other side, there are the long-standing economic problems in the country, such as rising inequality, poor governance, missing capacity for key development functions, a small manufacturing sector and a large and stub- born informal sector. See OECD, 2012; Kumar and Sen Gupta, 2008, for a brief discussion on these issues. The conduct of higher education has been repeatedly cited as an important factor (see for example, a recent article in the Economist (2013), or the World Bank Report (2012)). Our paper attempts to point out certain mechanisms which may connect the two and which starts right at campus recruitments.
In Section 1, we will begin with the actual placement data of IIT Bombay for the year 2013. We will present important features of this data, and most significantly, the allocation of students away from engineering and also away from a direct participation in the Indian economy. In Section 2, we delve deeper into sectors and argue that an important attribute of the misallocation is the selectivity or merit 5. of the JEE and GATE examinations used to admit students into IITB. The key point is that this merit seems well in excess of what can be utilized by Indian companies and agencies, es- pecially those engaged in engineering. In Section 3, we present mathematical models which illustrate some of the outcomes of excessive merit, especially in the presence of a global economy. We use the formulations of Kremer and Maskin (2003), and of Stiglitz (1975). We show that in this model, excessive merit does lead to rents and economic inefficiency for the less developed society. We point to certain connections of this mechanism with the current Indian economic situation. In Section 4, we adapt from Stiglitz’s work and defining a meritocracy and argue that the current Indian higher education scenario fails this definition. We examine current rationales for the conduct of higher education and their suitability. We show that abstract notions of merit and upward compatibility dominate this thinking as opposed to a downward accountability to social outcomes. We argue that mis-allocation and poor relevance are consequences of this approach and has led to poor outcomes. Finally, in Section 5, we suggest a way out by posing a set of research questions and recommending actions.
1. Placements at IIT Bombay
The first set of the Indian Institutes of Technology’s (IITs) were started in the 1950’s to address India’s growing needs for sophisticated technologists and engineers. Since then, the IITs have shaped the conduct of engineering pedagogy and research to a large extent (see Sohoni, 2012 for a fuller discussion) and dominate the rankings of India’s engineering colleges. They have also received and continue to receive generous funding from the MHRD 6.and from the Department of Science and Technology (DST), and other agencies of the Govt. of India (GoI), which are well in excess of any other institute, private or public, in the country. At the undergraduate (UG) level, the entrance to the IITs is now through an exam called the JEE (Advanced) in which about 0.15 million pre-selected students compete for about 7000 seats together for the 4-year B.Tech. program and the 5-year Dual Degree (DD) program, at the 15-odd IITs. The assign- ment of disciplines and programs are based on choices expressed by successful candidates and this allocation is done on the basis of ranks. For IIT Bombay, the so-called closing ranks in 2013 for B.Tech. (Computer Science and Engineering) was 59, for B.Tech (Electrical Engineering) was 135 and the lowest closing rank in engineering at IIT Bombay was 3057 for a “dual-degree” in Metallurgical Engineer- ing. The pre-selection itself is based on scores in a JEE (Mains) examination for which 1.2 million students sat in 2013. Both exams are in the form of objective type tests in Physics, Chemistry and Mathematics held across the country on specific dates.
Thus, selection to the IITs represents stupendous odds of about 1:200, making it possibly the most selective exam in the The JEE (Mains) is also used to admit another 7000 odd students to the 30 National Insti- tutes of Technology’s (NITs), which form the next rung of technical institutions.
At the graduate (PG) level, the entrance is conducted through a discipline-wise exam called the Graduate Aptitude Test in Engineering (GATE). For this exam, roughly one million students sit for about 5000 PG level seats at the IITs, again with odds of roughly 1:200. This exam is also an objective type exam on a loosely prescribed curriculum for each engineering and science disciplines and a few other streams. While the JEE is an admission test, the GATE is nominally a qualifying examination and MHRD fellowships are tied to qualifying GATE. GATE score cut-off are used to decide and rank students for admissions into the M.Tech. programs. 7 Most entrants to the M.Tech. program are graduates of non-IIT institutions. In general, the B.Tech. program is preferred over the Dual-Degree (DD) program and both are considered more prestigious than the M.Tech. program.
Given this selectivity of admission and an outlay of nearly 10 lakhs per year per student by the state, it is important that we analyse the benefits of this exercise to the Indian economy. We begin by analysing placements and classifying job allocations by sectors and segments of the economy. Our data is for 2013 and is sourced from the Placement Office the official manager of placements at IIT Bombay. The placements are a year-long process and our data is as of April 2013, by when more than 90% of the year’s placements had been made.
For this study, we consider the graduates of all the main disciplinary engineering departments of IITB, , Aeronautical and Aerospace (A), Chemical (CHE), Civil (C), Computer Science and Engineering (CSE), Electrical (EE), Mechanical (Mech.) and Metallurgical (Met.), and in these, the three main programs of B.Tech., DD and M.Tech. From this list, we have excluded the 5-year and 2-year Masters in Science (M.Sc.), Design (M.Des.) and Doctorate (PhD.) etc. for which the training and orientation of students are different. We have also excluded departments/ centers such as Energy Science and Engineering, Environmental Science and Engineering and so on, which are either specialized and/ or only for graduate students. This makes a sample of 833 (81%) placements out of a total of 1066 placements done by the Placement office. The total number of students who applied for placements was 1421. More details on the placement process and aggregate data is available in the official placement report for 2013 (IITB, 2013).
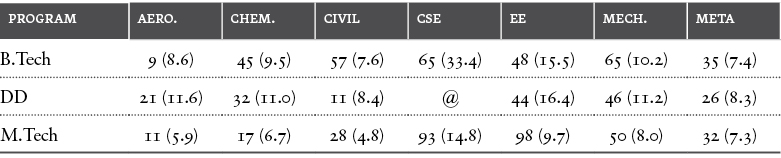
Table 1: Detailed number-wise break-up and average annual salary in Rs. lakhs.
Note:@-CSE does not have a dual degree programme;DD-Dual Degree. Source: Own computation from IIT Bombay placement data
In our sample of 833 students, 324 (39%) are B.Tech., 180 (22%) are DD and 329 (39%) are M.Tech. A detailed break-up with average annual salary in Rs. lakhs is given in Table 1. We see that the salaries roughly follow the JEE closing ranks, pointing to a connection between student programs and salaries (rather than, say, relative academic strengths of departments). As can be seen from the table, average salary of a B.Tech. graduate in CSE is highest, followed by the EE graduate and the lowest is that of Mettallurgical Engineering graduate. Similarly, B. Techs get on an average much higher salaries than DD students who in turn, earn more than M.Tech students – a reflection of the initial pecking order (i.e., the merit).
Sector and Company Attributes
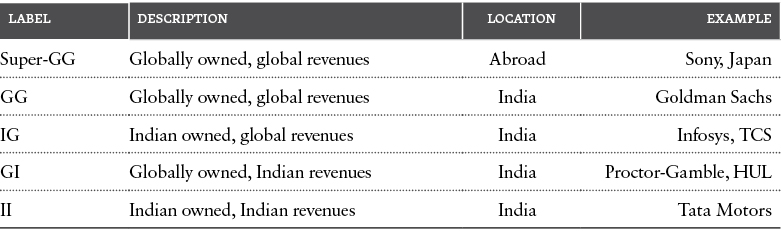
Table 2: Job and company profile label
For each job profile, along with the annual salary, we adopt the following two attributes. The first one is the sector, where we group the jobs into seven broad sectors: Consulting, Education, Engineering and Technology (ET), Finance, Consumer goods (FMCG), IT and finally non-IT Services. Clearly, the most relevant sector to IITB’s mandate and training is ET. The second attribute classifies the job location and company profile as in Table 2. The classification is based on company ownership, markets in which it operates8, and finally the location of the fresh recruit. Based on the second attribute, we can classify the firms into five categories, viz., (i) owned by Indian nationals and most revenue coming from local, i.e., Indian markets (II), (ii) owned by Indian nationals but significant share of revenue coming from global market (IG), (iii) foreign-owned but with revenues largely from Indian markets (GI), (iv) foreign-owned with most revenue from global market (GG)9, and finally (v) foreign firms for global markets with off-shore location (Super-GG). Each of the attribute has a different implication for our economy. For example, broadly speaking, the social returns to students placed in Super-GG or GG or IG accrue outside the society that has incurred expenditure in training the student10 On the other hand, social returns of students placed in II and GI companies accrue to the Indian society. Placement in GI companies may enable the transfer of technology to the Indian economy as techniques and practices employed elsewhere may be applied to local settings11. The two attributes of sector and company-profile, and the annual salary, will be used to analyse the placement data set.
With the above classification of job profiles and of sectors, we arrive at the following two tables. Table 3 presents the percentage of students in each program taking up jobs in the given sector, along with their average annual salaries in Rs. lakhs. For jobs which are placed abroad, nominal exchange rates as on July 30, 2013 have been adopted. Table 4 presents the allocation by various job profiles, i.e., of company ownership, principal market and location of job.
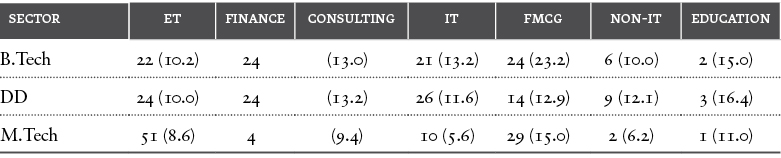
Table 3: Sector-wise allocations (in %) for the 3 programs and average annual salary in Rs. lakhs.
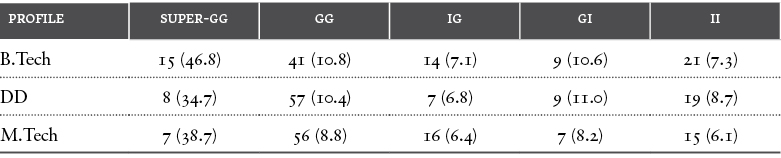
Table 4: Profile-wise allocations (in %) for the 3 programs and average annual salary in Rs. lakhs.
Based on these tables, we make the following observations.
1. For all programs, and across all (major) sectors, Engineering (ET) is not only the least paying but also the salaries decrease with an increase in the number of years of training, i.e., from B.Tech., DD to M.Tech.
2. Only about a quarter of the UGs and about half of the PGs take-up engineering jobs 12 This accounts for about 33% of the total number placed.
3. Global companies serving global markets (GGs) employ more than 60% of all graduates placed and pay more than 75% of the total annual salary awarded to graduates.
4. About 10% of all graduates recruited are placed abroad in GGs.
5. Except for DD students placed abroad or in IT, M.Tech. students receive less on the average than UG students. B.Tech.’s are preferred for serving global markets while DDs are preferred for Indian markets.
6. Indian companies serving global markets (IGs) pay the least and are not a major employer of IITB graduates.
7. The profile GI, i.e., global companies working for Indian markets, employs about 8.3% of the total number of students placed and about the same fraction of ET jobs. Thus, companies which possibly transfer technology to the Indian economy, employ a relatively small fraction of graduates.
8. Indian companies serving Indian markets (IIs) employ about 18% of IITB graduates and yet pay only about 10% of the total annual salary received. These jobs pay the least across all profiles, barring the IGs.
These observations lead us to two important issues, viz.:
• Misallocation – Placements seem to allocate graduates away from engineering (jobs) and also away from companies which serve Indian markets13.
• Limited Relevance – Secondly, the high paying sectors are Finance and Consulting, and to some extent IT, and these require fairly generic skills which are largely unrelated to the technical training that these students have undergone.
Both these issues point to a market failure which is important for two reasons, viz., (i) the loss in social outcome and (ii) the impact on the conduct of academic work of the institution. More precisely, this puts students’ interests/preferences at odds with the institute’s mandates (as, for example, listed in the IITs Review Report of 2004) and the research interests of its faculty members. This is especially worrisome for a publicly funded research institute.
2. The wage model
Our next objective is to perform a more nuanced analysis of the allocation data eventually leading to a wage-curve, i.e., a relationship between skills, sectors and wages. We will identify the main sectors of employment and try and isolate the key skill which resulted in the specific job allocation. We will base this on a simple theoretical model which incorporates both competition and allocation. Many authors have looked at college level ‘selectivity’ and its influence on future earnings of students. See for example, Dale and Krueger, 2002, Brewer and Ehrenberg, 1996 and studies cited therein which look at cross-institutional comparisons. Our specific analysis is on the influence of selectivity within an institute and is novel.

Figure 1: Wages vs. Productivity for a sector
Following Stiglitz (1975), let us consider an educational institution as a labelling device, as one which labels each graduate x with a single numeric label θ(x), with the assumption that θ(x) > θ(y) generally implying that x is more skillful or more productive than y. A firm is a collection of employees and the productivity of the firm may be a composite function of its employees. One measure of the productivity of a firm X is the mean labour productivity, θ(X) which is the mean of the labels (x) of all its employees, i.e., θ(X) = (Σ∈Xθ(x)/size(X). Analogously, we define the mean wage of all employees of X and denote it by s(X). For a particular sector S of the Indian industry, consider the collection of tuples {θ(X), s(X)}X∈S.
This collection of points may be plotted on a graph and abstracted by a curve C(S) as given in Figure 1. An important feature of the curve C(S) is the productivity numbers τ0(S), below which the sector will not hire, and τ1(S) above which the sector fails to marginally reward higher productivity. The existence of such a number τ1(S) is a reasonable expectation and is generally a measure of the sophistication of the sector14. It is also expected that employees with productivity above τ1(S) and yet working within the sector, represent the surplus productivity in the sector which contributes to innovation and an overall upward movement in the curve C(S) of the sector.

Figure 2: Wages vs. Productivity for many sectors
Suppose three sectors S0, S1 and S2 compete for the same set of prospective employees. Given their sector curves C(Si), the crossing points µij are particularly important. See for example the situation of Figure 2. It is clear that graduates with labels θ < µ01 will find employment in S0, while those with µ01 < θ < µ12 will prefer S1 and those with θ > µ12 will find S2 most attractive.
We also note that in the figure µ01 < τ1(S0), while µ12 > τ1(S1). Thus, we expect productivity growth in S1 but not in S0.
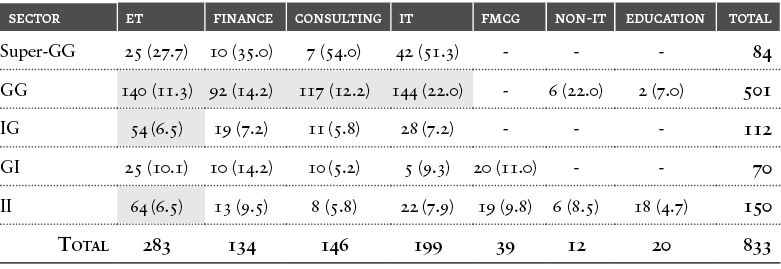
Table 5: Placement (No.) by sector and profile and average annual salary (Rs.Lakhs)
Note: Shaded sectors are those which have hired more than fifty students.
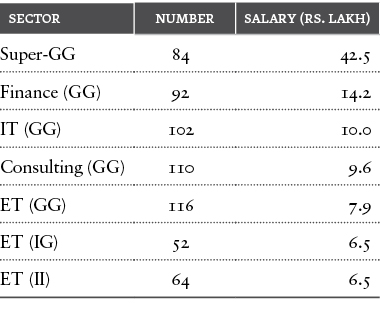
Table 6: Sectors and salaries
We apply this to our dataset. From Table 5, we see that there are six key sectors which hire 50 or more students. Besides these six, we include super-GG category, as it too has hired more than 50 students. These account for 610 (73%) of the 833 placements. Table 6 orders these sectors in decreasing order of salary.
Attributes of Productivity – Merit and Training
The productivity of a potential employee has several attributes – some readily observable and others non-readily observables, as identified in the literature (Bravo et al. 2012). Work ethics, motivation, maturity, decision-making skills, people skills etc. are some of the non-readily observables attributes. On the other hand, academic achievement, recommendations, undergraduate or post-graduate education, leadership experience, sports or extra-curricular participation are some of the observable attributes (ibid.). Among the observables, we pick two key attributes of graduating student – a) selectivity or merit, i.e., a measure of her skills before she joined the institution, and b) training, i.e., the skills that she acquired while at the institution. We classify selectivity for UGs and PGs separately by their joining discipline and program. The rankings for these are given in Table 7, with the higher number signifying higher selectivity or merit15. We have followed JEE rank closings except for the last two categories, viz., B.Techs and DDs for departments other than CSE, EE and Mechanical Engg. The reason for this will soon become clear.

Table 7: Ranking in selectivity
One important attribute of the training is the Cumulative Performance Index (CPI), which is a number between 0 and 10 and is a weighted linear combination of a student’s grades across her coursework. A grade lower than 4 in a course is a fail grade while the maximum possible grade is 10. Other attributes of training are guided projects done by the student, papers published, and so on. Finally, a third metric could be faculty opinion (other than CPI) of the student’s suitability and performance. However, in IITB and most other institutions, faculty opinion is neither sought nor supplied. The CPI remains the most widespread and standard measure of training and one which accounts for a large fraction of the students efforts, in terms of the time spent. CPI usually influences placements in three ways, viz., (i) a nominal measure used in cut-offs for short-listing, i.e., for forbidding students below a certain CPI to apply for a job profile, (ii) a positive measure in ranking successful candidates, and finally (iii) which reflects an actual preparedness and correlates with the performance of the student in interviews, especially on questions related to her domain. We use the CPI as the key attribute of training.
We next check if training, as measured by CPI, has a significant role in placements as measured by annual salary (ASAL). This is done by estimating a simple regression of the following form for each profile-sector pair, j.
ASALij = αj + βj CPIij + ε
Where, ε is the usual noise with mean zero and variance Ó2.
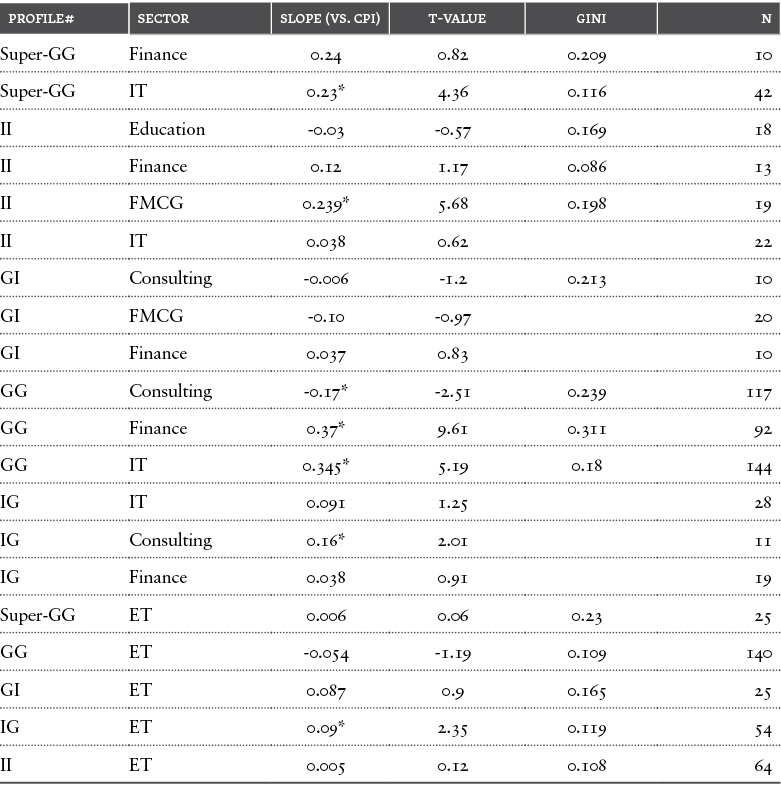
Table 8: Significance of CPI and checking inequality in salaries (i.e., Gini coefficients)
We now come to Table 8. The first few rows list all profile-sector pairs for which either (i) the linear regression of CPI vs. salary has a statistically significant slope, or (ii) where the Gini coefficient16 of the salaries is above 0.15. The last five rows of Table 8 list the data for the ET sectors, whether or not they satisfy the above two criteria.
Two key observations which connect relevance of training with the sectors of employment are:
Relevance in non-core sectors: We see that global finance, global IT and Indian consulting, are the sectors most sensitive to CPI. On the other hand, global companies serving Indian market for the same operations – finance, FMCG, consulting – are insensitive to CPI. Given that the disciplinary training is not relevant to these job profiles, the CPI is most likely used confirm the initial selectivity of the student. An interesting outcome is the negative influence of CPI on salary in the GG consulting sector17.
Poor relevance in core sectors: Surprisingly, barring one, all ET sectors are indifferent to CPI, and more so, firms which serve Indian markets, i.e., ET(GI) and ET(II). A notable exception is ET(IG), i.e., Indian engineering for global clients (albeit a small sector) which largely hires M.Tech graduates (72%) of non-EE and non-CSE streams18.
Thus, we see a disconnect between the training offered and salaries in the relevant sectors. On the other hand, there are a fair number of large Gini coefficients, which indicate significant variation in the salaries of graduates within the sector (column 5). Taken together this suggests that there are other attributes of merit which are at work and which may be distinct from CPI. These may come from other campus activities of students such as organization and participation in events, holding positions of responsibility and also individual distinction. Interestingly, it is the finance sector, especially for the global clients (GG(F)), where there is maximum variation in salaries. The sector not only values CPI but also some other attributes of merit, as indicated by high Gini.
Given the general insignificance of technical training, other than at the tail end of the selectivity spectrum, we are justified in using selectivity itself as a surrogate for the productivity label θ(x) for graduate x.
Sector-specific Selectivity
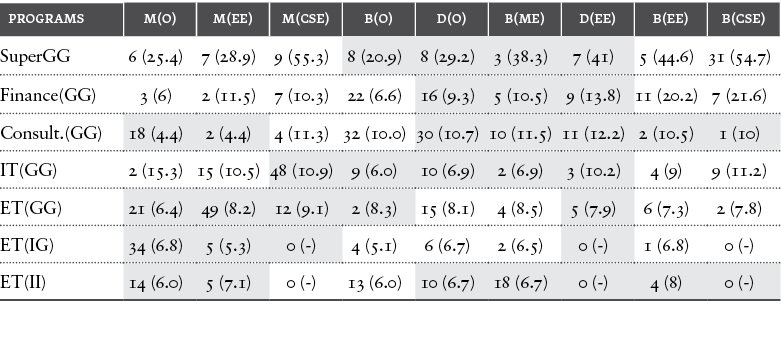
Table 9: Sectors and salaries.
Note: Figure in parenthesis give the average salary for the group; shaded regions means these categories have been considered for drawing the selectivity curves.
We now proceed to compute the sector curves C(S) for the major sectors above. For each of the seven sectors, we compute the number of students recruited from each selectivity group as shown in Table 9. Next, to plot the wage curves, we retain the largest three to five numbers (depending on the actual magnitude) for each sector. This truncation yields a sub-sample of 503 (60%) students of the total sample of 833. The ordering of the columns is an interleaving of the M.Tech. and the UG programs in roughly the order in which employers value these programs as measured by their average salary. Expectedly, separately within the UGs and the PGs, these roughly match the order of closing ranks at the JEE. Some PG programs, viz., M.Tech.(CSE) and M.Tech.(EE) have moved right after the UG programs in the same discipline thereby equating the selectivity of M.Tech.(EE) with B.Tech.(Mech.).
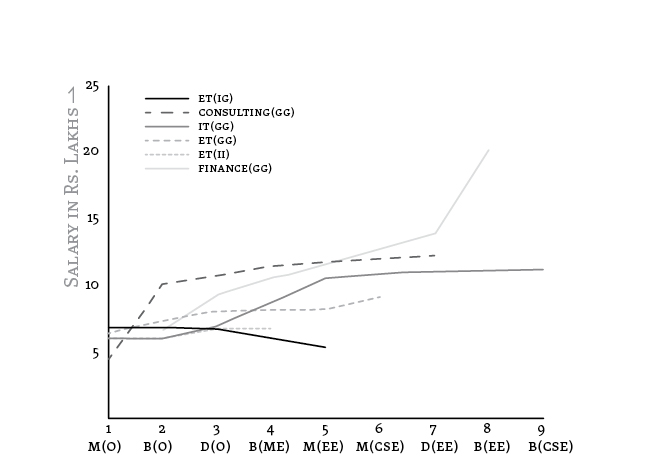
Figure 3: Branch/Sector specific Selectivity Curves
This leads us to the sector curves as shown in Figure 3. The curve for Super-GG has been dropped since (i) the average salary is more than twice the standard deviation of the next group, and (ii) the locations are in various places outside India, having different purchasing power, making it difficult to compare salaries. Figure 3 is rather revealing and the crossings indicate many key features of the placements at IITB.
1. ET(II), i.e., Indian engineering for Indian needs, pays upto about Rs. 6.7 lakhs per annum (p.a.). The selectivity for this is at B.Tech.(Mech.) or lower. Students paid salaries beyond that largely serve global companies with global markets.
2. Global engineering saturates at Rs. 9.1 lakhs p.a.; Global IT and Consulting saturate at a much higher level. Global finance does not saturate.
3. The lowest selectivity bracket (i.e., M.Tech in non-EE/CSE disciplines) stands out for placing most of its graduates in ET and very few in non-technical sectors such as Finance and Consulting.
4. ET (IG), i.e., Indian engineering companies serving global markets, stands out for being the most “technical” of all sectors. It pays more for CPI and for number of years of training. It largely employs M.Tech.(O).
5. Training at IITB (as measured by CPI) is largely irrelevant for ET companies serving Indian markets. It is moderately relevant to companies serving global markets.
6. The misallocation is not restricted to UGs. The allocation of the PGs, though more technical, is largely to global companies serving global markets. The M.Techs in CSE largely work for IT(GG), and those from EE work for ET(GG) companies respectively. Other M.Techs contribute to ET(IG) and, to a small extent, ET(II). Thus, the biggest beneficiaries of the M.Tech. programs are global IT and global engineering services.
7. For most UGs, non-technical sectors dominate salaries and placements, and also employ a substantial number of graduates. At selectivity below B.Tech.(Mech.), it is Global Consulting which dominates the job market, while beyond that it is Global Finance.
8. For most UG students, the training received in their programs, as measured by their CPIs, is either irrelevant to their sector of employment, or if relevant, it is largely inconsequential. Selectivity at the time of entering the institute has a substantial influence on sectors and on salaries.
The above analysis reveals excessive selectivity or merit at the high school levels, i.e., exceptional performance in a multiple-choice examination on a high school syllabus, to be an important factor in determining salaries of fresh engineering graduates. It contributes significantly to the misallocation of students away from ET sectors and away from direct participation in the Indian economy and to a set of highly branded and well-paying service-sector jobs. The analysis also shows that for UGs, the selectivity even manages to trump the technical training that IITB imparts. This training and the current curricula at IITB is perhaps valued by global engineering companies but is unable to command any premium in engineering placements for Indian markets, leading us to question their relevance to Indian needs and engineering practices.
This provides an answer to both the misallocation and the relevance problems posed in the previous section. However, it also leads us to the JEE and GATE exams, which form the basis for selection of students into the IITs. These exams, especially the JEE, have substantial influence on school curricula and also the pedagogy of science in the country (see for example, Sec. 6.5 of NCERT, 2006). The spectre of irrelevance leads us to GATE, the certifying examination for all engineering graduates in the country, and one which is administered by the IITs and is largely based on curricula deemed as “core” by the IITs. In fact, both these exams touch upon the very conduct of higher education in the country, a sector identified as crucial for our economic development.
Our next objective is to offer a connection of identifying merit in a globalized world with some of the deeper problems in the Indian economy, especially the conduct of training and research in science and technology, stagnant and poor quality manufacturing, few entrepreneurs per capita (Ghani et al., 2011) and poor development outcomes. Globalization has been implicated by many authors as an important factor in poor development outcomes and rising inequality. See for example, Kremer and Maskin (2003), Kremer (2006) and the references therein. In fact, Kremer and Maskin offer an explanation for this which seems applicable here. They provide a mechanics of job formation and merit and its connection with societal inequality. It is noteworthy that they mention India explicitly as having a possible “dualism” in its economy.
3. Globalization, inequality and excess merit
In this section, we connect the identification of merit and subsequent allocation to broader macro-economic variables. We show that in a stylized globalized world, an identification of excess merit within the less developed society poses certain allocation risks. This in turn, may lead to higher initial wages, but eventually to lower wages, higher inequality and a loss of entrepreneurial skills within the less developed society.
We adapt and extend some of the arguments of Kremer and Maskin (2003). As before, a society consists of individuals x, each with a productivity or skill level θ(x). All firms in this society have only two employees, viz., the manager and the assistant with the assumption that the manager manages, i.e., interfaces between society, market and the production process, while the assistant handles routine production. The production of this firm is as follows: if the skills of the manager and the assistant are ‘a’ and ‘b’ respectively, then the output of the company (a, b) is the stylized production function f given by f (a, b) = a2b. This is a variation of the popular Cobb-Douglas production function and is used routinely in the literature, see for example, Kremer (2006), Kremer and Maskin (2003). The basic assumption is that workers of different skill levels are imperfect substitutes and different tasks within the production process are complements (Kremer and Maskin, 2003). It is easy to infer that if a > b then the company (a, b) has higher productivity than the company (b, a). In other words, for a larger output, the manager should be the person with the higher productivity.
Let us consider a society S with only two types of people, viz., consisting of ai’s and bj’s with skill levels θ(ai) = a, and θ(bj) = b with a > b. In such a situation, three types of firms are possible, viz., (ai , aj), (ai , bj) and (bi , bj). Let us consider the question of the nature of firms in this society which maximize social output.
As in a lemma of Kremer and Maskin (2003), for ì = (1+√5)/2 , if a < ì.b, then the output of the society S is maximized by cross-matching skills i.e., maximizing the firms of the type (ai, bj). On the other hand, if a>.b, then the output is maximized by minimizing the number of firms of the type (ai, bj) i.e., having more firms of the same type (ai, aj) and (bi, bj).
The proof is easy and we illustrate using an example below. The lemma explains why a society with members with sufficiently unequal skill-levels and productivities are likely to create a “duality” in industrial structure with un-mixed firms, wherein these members have independent economic trajectories.
Consider a society with 4 persons of skill levels {2,2,3,3} i.e., with a 50% skill gap between the two worker types. For the mixed company set (3,2), (3,2), the net output is 2 x 32.2 = 36. The pure firm set (3,3), (2,2) generates net output of 35 (i.e., 27+8). On the other hand, for S2, with skill levels {4,4,2,2}, the mixed-company set gives an output of 64, while the pure set yields 72. Thus, S2 will have two disjoint societies S0 = {4,4} and S00 = {2,2} with independent economics.
For a firm (a,b) with output a2b, let the wages be divided in the ratio 2a:b i.e., in the ratio of their marginal productivities. We now consider the case of two societies S1 and S2 – one predominantly developed and other developing – and study their interactions.
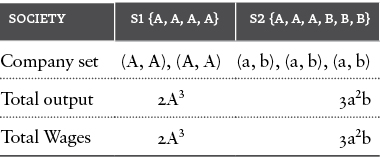
Table 10: Unglobalized world
Let S1 have 4 people of identical skill levels A and S2 have 6 people with skills of a,a,a,b,b,b with A > a ≥ b and also a < ì.b, i.e., a and b are sufficiently close. In the unglobalized case, when S1 and S2 do not interact with each other, social output and wages would be as per Table 10. We assume that (i) societies arrange firms so that output is maximized, and (ii) the firms operate in a competitive environment and that their net produce is distributed as wages in the ratio above. Thus, since there is no interaction between the societies, for each society, the total wages equal the total output of the companies. As an example, consider the case with A = 4 and a = b = 2, Table 11 computes the wages of the managers and their assistants with some additional details.

Table 11: A specific un-globalized world
For the globalized case, we allow firms to have employees of either society so that, in the steady state, the overall output of both societies together is maximized. For the purpose of accounting, we assume that (i) the owner of the firm is the manager; and (ii) the output of the firm is consumed by the society of the manager and is accounted as such. Similarly, the wages of a worker accrues to the total wages earned by the society of the worker. Finally, we compute effective wages by scaling the wages to match the net output of the society. This captures the fact that the wages follow the total output of the economy.

Table 12: Unglobalized world (with selectivity) for S2°

Table 13: Globalized world (with selectivity) for S2°
As the globalized regime allows for joint firms, i.e., firms with members of both societies, for case when A > m.a, globalization does not result in any interaction between S1 and S2 (Table 11).19 Now suppose that society S2 conducts a test and identifies two members of S2 to be of relatively higher skill (i.e., skill of 3 instead of 2), and let us call this new society as S20 (Table 12). We see that this will immediately lead to an interaction between the two societies as illustrated in Table 13. We also consider the case, when higher skill level in S2 is identified to be 2.5 and not 3 (and we call this as case S200). Interestingly, for a lower skill identification, i.e., of 2.5, with 4 >m.2.5, the globalized and un-globalized outcomes remain the same and are captured in Table 14: We compare the relative outcomes for each society, and in each situation, as follows:

- Comparing (S1, S200) with (S1, S20), we see that nominal wages for S20 are higher than in S200. The net output of S200 is more than in S20 and the effective wages for everyone in S200 are higher than in S20. Thus, this creates the paradoxical situation where identification of increased skill levels from S20 to S20 actually reduced effective wages for all.
- Comparing the situation (S1, S20) and (S1, S200), it is clear that most members of S1 will prefer S20 as a partner society than S200. In other words, if members of S200 can indeed be identified as being of skill level 3 instead of 2.5, then it is S1’s interest to aid this identification and labeling. On the other hand, it is in S2’s interest to suppress this labelling. Thus an identification of merit greater than 2.5 is detrimental to the interests of S2, and to members of S2.
- In any economy, the impact of increase or decrease in nominal wages is immediately felt by the workers, while the change in real/effective wages takes some time to register. Thus, for a member of S2 of skill level 3 but an identified skill level of only 2.5, there is an immediate incentive to identify herself with the higher skill level of 3 and earn wages of Rs. 19.2. However, her eventual real wages decline from Rs. 7.7 to Rs. 5.6 if she and her cohort does indeed identify itself or not able to get recruited by S1.
- Compared to S20, there are few managers in S200. As assumed earlier, being a manager entails more innovation and enterprise than being an assistant, whence the identification of members of S20 of skill level 3 actually converts them from managers to an easier role of assistants and yet increases their nominal wages.
- In this particular example, and as measured by the Gini coefficient, globalization has led to an increase in inequality in S2 and a decrease in inequality in S1. It has also led to a concentration of managers in S1 and assistants in S2.
4. Selection and Meritocracy
The previous section highlights a mechanism of how skill differentials may be exploited by different agents and societies. It also shows that many important attributes of a society, such as inequality, the number of managers and entrepreneurs, aspirations of highly skilled workers, skill assets of a company etc., are intimately tied to strategic decisions of training and identification of skills within a society. As Kremer and Maskin (2003), Brezis and Courzet (2004), among others have argued, these mechanisms may play out on a national scale and directly impact macroeconomic variables.
Thus, we see that identifying and nurturing merit, especially at state’s expense, is potentially risky in a globalized world and must be done with due diligence. This diligence must include an analysis of the allocation of the ‘excellent’ to various positions within a society’s economy or outside it. A society must also be careful about defining merit, especially if it means adopting metrics of productivity and skills of a different society and also of training its members to succeed on these metrics. Without this due diligence, the selection process will result in a transfer of key productive assets from the less developed society to the more developed one20.
Following Stiglitz’s (1975), let us define a meritocracy as a democratic society characterized by four attributes. These are (a) a notion of merit and a labelling and sorting function, (b) productive processes which utilize this sorting to increase net social output. As we have seen, a correct labelling tends to increase wages for the more productive at the cost of the less productive. Thus a state-funded labelling process will succeed only if (a) and (b) are coupled with (c) mechanisms to distribute this surplus so that a majority of the people benefit, and finally (d) an informed majority which votes for such a labelling having understood the process, its economic ramifications and the social outcome. We will call a society possessing properties (a)-(d) as a meritocracy.
The IITB placement situation is but one witness to how higher education in India fails to be a meritocracy. We begin with a conflicted notion of merit, we identify and train agents for whom we have no useful productive processes, and finally, there is no distributive mechanism which will benefit a majority of us, unless we believe in the trickle-down from the global economy. Thus, this violates properties (a)-(c) of our meritocracy, whence, assuming a rational majority, it is a surprise that (d) holds at all. That it holds is largely because of the perception that the admission process is fair and locates talent. While superficially true, it masks the fact that high odds such as 1:200, makes any admission process highly coachable. That the labelling is fair and meritorious and offers inordinate rewards for the few and an escape to a better society creates an aspirational dysfunction (see Sohoni 2012) and deflects attention from the fact that the labelling is actually socially negative.
There are of course, many other witnesses, in both the physical as well as the social sciences, and at all levels of education. Most of these are rooted in a peculiar rationale for education which is upward compatible, i.e., enabling the excellent to migrate to a better society, at the cost of being downward accountable, i.e., enabling a majority to do better in situation. This is illustrated, for example, by the rationale for the class XII Physics curriculum of NCERT-201221,2which we reproduce below.
“The higher secondary stage is crucial and challenging stage of school education as it is a transition from general science to discipline-based curriculum….. There is a need to provide the learners with sufficient conceptual background of Physics which would eventually make them competent to meet the challenges of academic and professional courses after the higher secondary stage.The present effort of reforming and updating the Physics curriculum is an exercise based on the feedback received from the school system about existing syllabus……… The recommendations of National Curriculum Framework-2005 have been followed, keeping the disciplinary approach with rigour and depth, appropriate to the comprehension level of learners. Due care has been taken that the syllabus is not heavy and at the same time, it is comparable to the international standards. Also, it is essential to develop linkages with other disciplines for better learning of Physics concepts and establishing relationship with daily-life situations and life-skills.”
Thus we see upward compatibility of not inconveniencing the few excellent students who go on to professional courses after class XII, meeting international standards and other internal requirements as higher priorities than the downward accountability of enabling students to interpret daily-life situations. Such a peculiar focus on identifying the excellent and catering to their trajectories is a hallmark of the elitization of our higher education by elite institutions and one which is recommended to the not-so-elite ones as well. It is also responsible for much of the misallocation and irrelevance in the outcomes of higher education.
5. Where do we go from here?
The conduct of higher education is too broad a subject for us to handle here and we will limit our-selves to the IITs and perhaps to the broader ambit of engineering education.
The first question, of course, is to establish if 2013 was a special year and if IITB is a special case. To answer the first sub-question, we must point to the analysis done by Sukhatme and Mahadevan (1988), of “brain drain” in the 1970s. In that era too misallocation was rampant and it was implemented by graduates moving abroad for higher studies. That said, not much systematic data is available in the public domain and there are no standard formats. Even the format for IITB has changed twice over the last 5 years. However, based on what is available and through private conversation with the IITB placement coordinator, (i) the data for 2012 and 2011 reflect a similar allocation, and (ii) the old IITs, to a greater or lesser extent, have a similar allocation profile (Anant, 2011) and hence the consequent issues of misallocation and poor relevance. In the next rung, i.e., the NITs, a similar allocation is seen, albeit to the IG companies working in IT and ET sectors. See for example, the placements of NIT (Bhopal)22, where the “software” sector is the biggest employer by far. There are some exceptions, e.g., NIT(Durgapur)23, which placed roughly 100 UG graduates (out of 607) into the steel and mining industry. On the whole, it would be useful for MHRD to evolve frameworks for reporting placements from the IITs and the NITs and other colleges. This would help in the analysis of selectivity and training, institutional profile, etc., and its relationship with wages for engineering companies for Indian markets and for global service companies.
Secondly, and more broadly, it is for MHRD to focus on five sets of questions below. The timing for this is crucial since (i) it is in the process of rolling out Phase II and the design of Phase III of the TEQIP program of investments in engineering colleges, and (ii) the IITs are headed for a review in 2014.
Question 1: What is the role of elite institutions? What is their influence on the conduct of R&D for the benefit of society? Are these the role models for other institutions? Are they the right custodians of curricula for a developing country?
Question 2: What are the key developmental demands, explicit or implicit, that Indian society poses for engineers? What are the key strategic sectors? What is the training and research that is required of engineers to work for these needs? Are the IITs and other engineering colleges preparing students to face these demands?
Question 3: Is engineering placement working to the satisfaction of these demands? Are there better mechanisms to match supply with demand? Is the company-employee model the only one or are there other models, such as the apprentice, entrepreneur, consultant or the development professional? Is there a need for closer collaboration between MHRD and key state development agencies?
Question 4: What is the correct input mechanism for India’s engineering colleges? What is the impact of the current methods of input on the conduct of training and research within our colleges? What are the externalities of the method of selection, especially on the school curricula?
Question 5: What is the impact of globalization on society and on engineering education? What would be the impact of accreditation of our engineering education to an international
definition of engineering? What is the locus standi of our strategic and developmental needs in this universalization of engineering?
Some answers to the above questions are partly offered in Sohoni (2012), (2013). The broader strategy should evolve from a multi-stakeholder and inter-ministry consultation. The first step is to spell out a theory of knowledge and practice for India as a developing country. Practice is an important element of engineering for a society in which basic engineering services of sadak, bijli, paani (i.e., roads, electricity, water) are still unmet. The second step is to develop the regional engineering college as a knowledge resource and as an incubator of civil society. The training within such a college should be inter-disciplinary and instrumental and enable the engineer to work directly with society. Foremost, the elite university must bring rigour and legitimacy to this important agenda. It must help society to discover new ways of delivering value and of new professions and innovations within a strategic and developmental context.
Acknowledgements:
We acknowledge with thanks the IIT Bombay placement office for giving us the data. An earlier version of the paper was presented in a symposium at IIT Kanpur. Our thanks to the symposium participants for useful comments. We also thank Ashok Sohoni and Anil Kulkarni for many comments, and Maunik Shah for managing the data. The disclaimers apply.
References
- Agarwal, P. (2006) Higher Education in India: The need for change, Working Paper 180, ICRIER: N. Delhi ( http://www.icrier.org/pdf/Working_Paper_180.pdf accessed in March 2014).
- Anant K. (2011) Does technical education in India contribute to its Core-HRST? A case study of IIT Madras, Science and Public Policy, 18(4), 293-305 (May).
- Aspiring Minds (2011) National Employability Report–Engineering Graduates 2011, AspiringMinds, ( http://www.aspiringminds.in/docs/national_employability_report_engineers_ 2011.pdf accessed in Oct 2013).
- Bravo, G., D. Won and D.J. Shonk (2012) Entry-level employment in intercollegiate athletic departments: Non-readily observables and readily observable attributes of Job candidates, Journal of Sports Administration & Supervision, 4(1), May.
- Brezis, E. S. and F. Crouzet (2004) The role of higher education institutions: Recruitment of Elites and Economic Growth, CESifo working paper 1360, http://econ.biu.ac.il/files/ economics/shared/staff/u46/cesifo1_wp1360.pdf accessed in Nov. 2013.
- Brewer D., E. Eide and R. Ehrenberg (1996) Does it Pay to attend an Elite Private College?
- Evidence from the Senior High School Class of 1980”, Research in Labour Economics, 15,239-71.
- Chatterjee, P. (2002) Social Science Research Capacity in South Asia, SSRC, New York.
- Dale S. B. and A.B. Krueger (2002) Estimating the payoff to attending a more selective college: An application of selection on observables and unobservables, Quarterly Journal of Economics, 117(4): 1491-1527 (Nov.).
- The Economist (2013) India in trouble: The Reckoning, The Economist, Aug. 24th, 2013.
- Ghani, E, W. R. Kerr, and S. D. O’Connell (2011), Spatial Determinants of Entrepreneurship in
- India, NBER Working Paper No. W17514, NBER.
- IITB (2013) Placement and Internship Report, 2012-2013, published on 31st July 2013, Indian Institute of Technology Bombay. Available at
- http://placements.iitb.ac.in/files/IITB Placement Internship Report 2012-13.pdf
- The Indian Institutes of Technology: Report of the Review Committee (2004). Available at: http://www.iitk.ac.in/infocell/commrev/committee/ (as on 15th August 2013).
- Indian Express (2011) Govt funds 80% IIT expenses, students pay back a fraction, Sep. 20, 2011, Mumbai.
- 20
- Kathuria, V. (1999) Role of externalities in inducing technical change – A case study of Indian machine tool industry, Technological Forecasting and Social Change, 61(1), 25-44.
- Kathuria, V. (2002) Liberalisation, FDI and Productivity Spillovers – An analysis of Indian Manufacturing firms, Oxford Economic Papers, 54: 688-718.
- Kathuria, V., S.N. Rajesh Raj and K. Sen (2013) “The effects of Economic Reforms on Manufacturing Dualism: Evidence from India”, Journal of Comparative Economics, 41(4): 1240-62
- Kremer, M. and E. Maskin (2003), Globalization and inequality, WCFIA working paper, Harvard University.
- Kremer, M. (2006), Globalization of Labour Markets and Inequality, Brookings Trade Forum: 2006, 211-28.
- Kumar, R. and A. Sen Gupta (2008) Towards a Competitive Manufacturing Sector, Working Paper 2003, ICRIER: N. Delhi ( http://www.icrier.org/pdf/Working_Paper_203.pdf accessed in March 2014).
- NCERT (2006) Position Paper: National Focus Group on the Teaching of Science, NCERT, New Delhi.
- OECD (2012) India: Sustaining High and Inclusive Growth, OECD “Better Policy” Series,
- October ( http://www.oecd.org/about/publishing/IndiaBrochure2012.pdf accessed in March 2014.
- Pavcnik, N. (2011) Globalization and within-country income inequality, in Marc Bacchetta and Marion Jensen (eds.) Making Globalization Socially Sustainable, ILO, Geneva, chapter 7, 233-59.
- Sohoni, M. (2012) Engineering teaching and research in the IITs and its impact on India, Current Science, vol. 102, No. 11, 1510-1515, (2012).
- Sohoni, M. (2013) Curricula and Extension at Engineering Colleges, TEQIP-II, a concept note, IIT Bombay (Available at www.cse.iitb.ac.in/sohoni/enggv2.pdf).
- Stiglitz, J. (1975) The theory of screening, education and the distribution of incomes, American Economic Review, vol. 65, no.3, 283-300 (1975).
- Sukhatme, S.P. and I. Mahadevan (1988), Brain Drain and the IIT graduate, Economic and Political Weekly, vol. 23, No. 25, pp 1285-87 (June).
- Topalova, P. (2010) “Factor immobility and regional impacts of trade liberalization: Evidence on poverty and inequality from India”, American Economic Journal: Applied Economics, 2(4): 1–41.
- te Velde DW (2003) Foreign Direct Investment and Income Inequality in Latin America, ODI Working paper 1928 ( www.odi.org.uk/resources/docs/1928.pdf accessed in May 2014).
- World Bank (2012) More and Better Jobs in South Asia, World Bank, Washington DC.
Footnotes
1. These acronyms stand for the Indian Institute of Technology, Indian Institute of Science, Indian Institute of Science Education and Research, Jawaharlal Nehru University and the Delhi School of Economics respectively.
2. Despite obvious limitations of diffent ranking systems, which are often biased against developing countries institutes, these institutes have often figured in top 200 to 300 institutes of the world in their respective fields. A brief discussion on ranking of different IITs and the limitations of such ranking is giving in http://www.insightiitb.org/2013/world-university-rankings-with-a-pinch-of-salt/(accessed in jan. 2014).
3. This monopoly is long standing. Aggarwal (2006) gives few examples for the decade of 2000. In engineering, in 2001-02 of the 650 doctorates awarded, 80% were from just 20-top universities. In science, 65% of the doctorates awarded were from the top-30 universities (ibid.). Similarly, a study conducted on Social Science Research Capacity in South Asia in 2002 showed that one fourth of special articles published in the Economic and Political Weekly was dominated by only three universities, namely JNU, University’s of Mumbai and Delhi (Chatterjee, 2002 as referred in Aggarwal, 2006).
4. JEE, JAM and GATE stand for Joint Entrance Ex- amination for admission in under-graduate (UG), Joint Admission test to Sc. and Graduate Aptitude Test in Engineering for graduate programmes.
5.Merit is the term used by the IITs in announcing their JEE admission rankings.
6.In 2009, the operating revenue of IITs was 942 crores, which increased to Rs. 1283 crore in 2010 and 82% of which came as grants from MHRD. Estimates suggest that against expenditure of 8-9 lakhs per B.Tech. student, the tuition fee is only Rs. 2 lakhs and rest is borne by the government (Source: Indian Express, Sep. 20, 2011).
7.Of late, several public sector units (PSUs) are also using GATE score to shortlist candidates for recruitment.
8.We used web-sites of different companies and other published information to find out their markets.
9. All globally owned firms, though get most of the revenue from global market, but given the location of placement offered, we could decide whether it is meant for local operations or for global operations.
10.It can be argued that the returns have to be seen over a longer time horizon. In that case, we need to also see remittances of those employed by super GG. This requires studying a cohort of students employed by super GG and tracking their employment over the period, which is beyond the scope of present study.
11.There is a large body of literature which talks about the role of employees in transferring this technology. See for example Kathuria (1999) for an evidence of this role in Indian machine tool industry.
12.It is well acknowledged that the engineering companies often are not able to match the salaries of finance and consultancy companies. This is not unusual given the fact that the value addition is much higher in services than in manufacturing, and the remuneration goes accordingly.
13.This misallocation has been reported by others also, see for example, Anant, 2011 for IIT Madras.
14.Not only sophistication, from efficiency wage theory, we know that it also depends on ownership of the firm. A foreign firm to avoid adverse selection, moral hazard and cost of rehiring tend to pay high salaries for higher τ.
15.It is to be noted that this is just an ordering. Second rank does not imply that candidates in rank two are only half as meritorious as the top-ranked students.
16.The Gini coefficient is a traditional measure of inequality (such as income or access to a resource etc.) or spread in a set of non-negative values. A Gini of 0 indicates equality of all values while an index of 1 indicates complete inequality. A value closer to one indicates more inequality in salaries offered.
17.We don’t have any explanation for this. A more disaggregated analysis at firm level is needed that would look into which kinds of GG firms devalue CPI.
18.Over 83% of their hiring is from Mechanical, Metallurgy and Chemical engineering streams.
19.In such situations, even if foreign firms do relocate to developing countries, they form enclaves with hardly any interaction with indigenous firms (Kathuria, 2002).
20.A clear manifestation of this is increased inequality within the society and across rural-urban areas in countries that have liberalized and given access to foreign firms. See Kathuria et al. (2013) for increase in manufacturing duality after liberalisation in Indian case, having implication for inequality. te Velde, 2003 for Latin America and Topalova (2010) for India also find increase in relative poverty with trade. Pavcnik (2011) gives a concise review of the impact of globalization on income inequality for several countries and concludes the same.
21. http://www.ncert.nic.in/rightside/links/pdf/syllabus/syllabus/desm_s_physics.pdf accessed on August 2013.
22.Source: http://www.manit.ac.in/manitbhopal/index.php?option=comcontent&view=article&id=639 accessed on 10th October, 2013.
23.Source: http://www.nitdgp.ac.in/placement_activity.php accessed on 10th October, 2013.
Authors of this article are :
 Prof. Milind Sohoni (B.Tech, ’86, PhD ’93 CSE H4 & H1): Prof. Milind Sohoni is a Professor at the Department of Computer Science and Engineering at IIT Bombay. He is also from the class of 1985 ‘Technology & Sustainable Development’ Chair Professor at IIT Bombay.
Prof.  Vinish Kathuria: Prof. Vinish Kathuria is a Professor at Shailesh J Mehta School of Management at IIT Bombay. He is the recipient of 2010 Mahalanobis Memorial Medal (National) Award in the area of Quantitative Economics.