Study Purpose
The Indian society has come a long way in terms of educational opportunities, especially with respect to admissions to elite institutions like IIT Bombay. Our project examines the demographic differences between undergraduate class of IITB in 1970 and the batch that graduated in 2019. In both cases, entrance to IITB was based strictly on student ranking in the All India Joint Entrance Exam (JEE). Our analysis highlights categories that reflect the diversity of students.
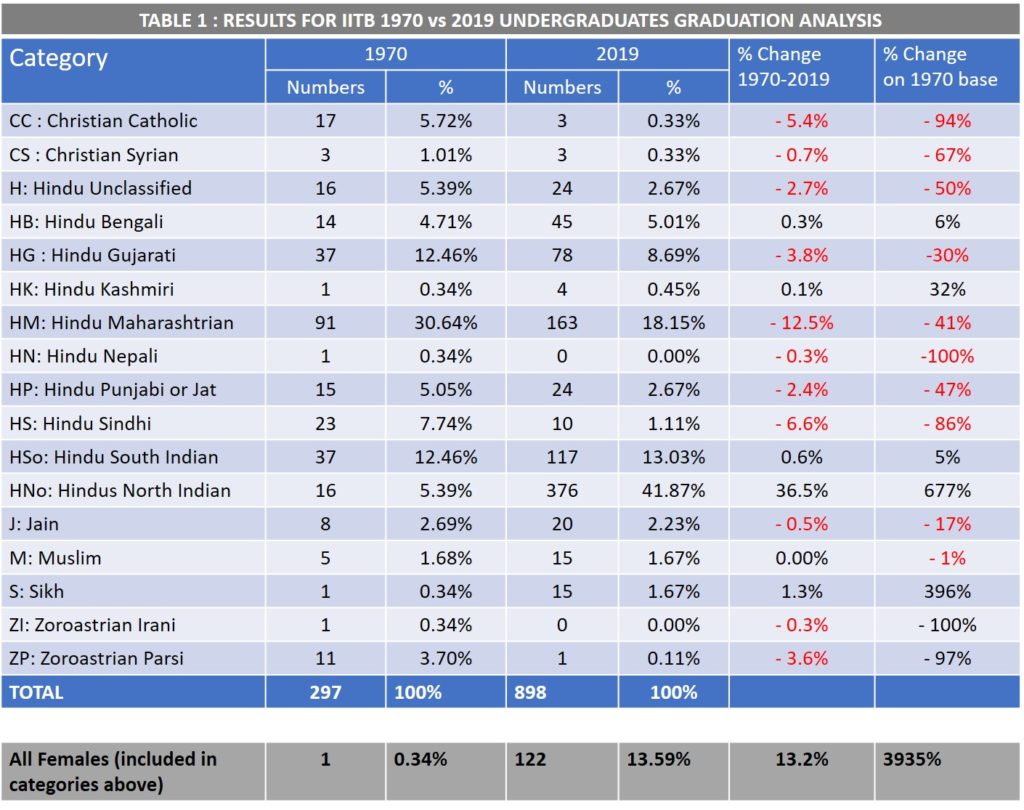
IITB itself has seen significant expansion with respect to class size. In our batch of 1970, we had a total of 297 who graduated with a BTech degree. In 2019, the undergraduate batch increased to 898, a whopping 200% increase in 49 years. At the same time, India’s population went from 555 million in 1970 to 1.35 Billion in 2019, a 143% increase in population.
Background Information
It is important to note that there are several major differences between 1965 and 2015 in how the JEE was conducted and how students were ranked. In 1965, when the 1970 batch graduates joined IITB, all 4 subjects — English, Physics, Chemistry and Mathematics had equal weightage, with a minimum number of marks required in English to get ranked. In 2015, when the batch that graduated in 2019 joined IITB, the JEE was divided into two parts. JEE Mains prequalified approximately 10% of the students to take the JEE Advanced exam. Only a minimum number of marks were required in English in JEE Mains, but, the English marks did not count towards prequalification. Also, students had the choice to write their exams in one of many different Indian languages or in English. The JEE Advanced exam taken by the 150,000 prequalified students (from the JEE Mains) only had three subjects — Physics, Chemistry and Mathematics.
In 1965, there was no caste-based quota system. In 2015, the Government of India had established a well-defined quota system among the prequalified students who cleared JEE Mains.
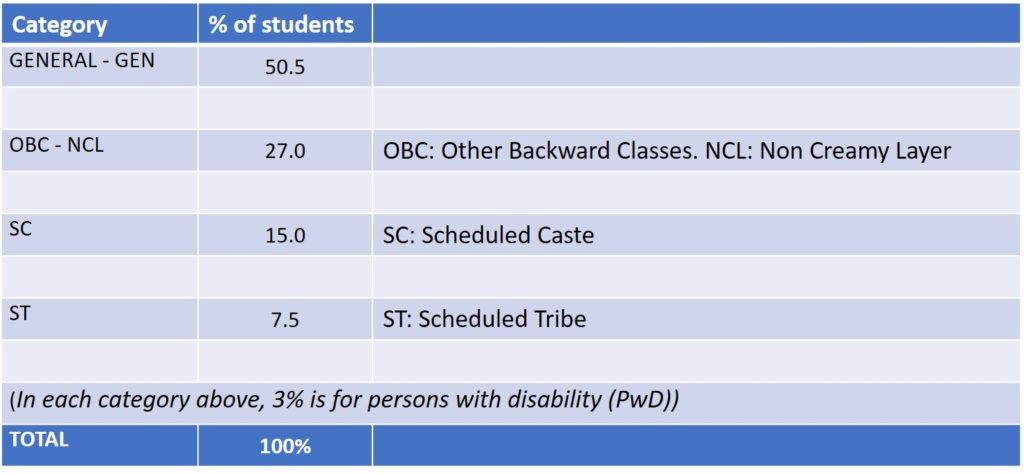
The number of UG students who entered IITB and other IITs across the country in 2015, based on the quota system, reflected the ratios given above. It is interesting to note that at least in IITB, the dropout rate of students is extremely low – less than 1%. This is an indication that the implication that SC/ST students are unable to cope with the rigorous education at IITB is simply not true.
The authors appreciate the extent to which the Indian government has gone to make our elite institutions accessible to all the social classes in our society. The admission process has been made fair by a) removing English (a subject that favored the students who came from a wealthier class and did their high school education in English medium) as a requirement for pre-qualification , and b) establishing quotas for OBC, SC and ST and in all categories establishing a 3% quota for Persons with Disability (PwD).
Finally, our analysis also indicates an increase in the number and percentage of female students who graduated in 1970 vs 2019. In 1970, we had only 1 female student graduate out of a total of 297 total undergraduates – resulting in the female percentage rate of a dismal 0.34%. In 2019, 122 females graduated out of a total of 898 total undergraduates. This is a 13.59% female graduation rate – a phenomenal 3,935% increase. It is still far below a 50:50 ratio, but significant progress has been made with respect to gender diversity. In the last few years, female students have also been given a special category quota.
Methodology
All students were assigned one of the following categories based on their First and Last Names. There may be a small percentage of error in assignments, but it is statistically insignificant.
CC: Christian Catholic
CS: Christian Syrian or Orthodox
H: Hindu Unclassified (we could not neatly place them in one of the many Hindu categories)
HB: Hindu Bengali
HK: Hindu Kashmiri
HM: Hindu Maharashtrian
HN: Hindu Nepali
HP: Hindu Punjabi or Jat
HS: Hindu Sindhi
HSo: Hindu South Indian (those from Andhra Pradesh, Karnataka, Kerala, Tamil Nadu & Telangana)
HNo: Hindus from Rajasthan, UP, MP, Bihar, Uttar Pradesh, Jharkhand, Uttarakhand
J: Jain
M: Muslim
S: Sikh
ZI: Zoroastrian Irani
ZP: Zoroastrian Parsi
F: Females separately listed for gender calculation, but included in categories above
Note: We were unable to separate out General, SC, ST and OBC classes, but by mandate, they are in one of the Hindu categories in their respective percentage requirements.

Conclusions
- Dramatic changes in Indian government regulations for admissions to IITs resulted in a major change in the student demographics. Some of the main changes in admissions and reservations from 1965 to 2015 were (A) Removal of English as a subject for JEE ranking (B) Reservation of seats for SC, ST and OBC with a sub-category for PwD in each category (C) More women are joining engineering institutions. This is still a work in progress. (D) The above results reflect a far fairer distribution of students, with the underprivileged SC, ST and OBC groups dramatically boosting the Hindu percentage far in excess of their proportion in India’s population. Our assumption is, that all SC, ST and OBC groups are Hindus.
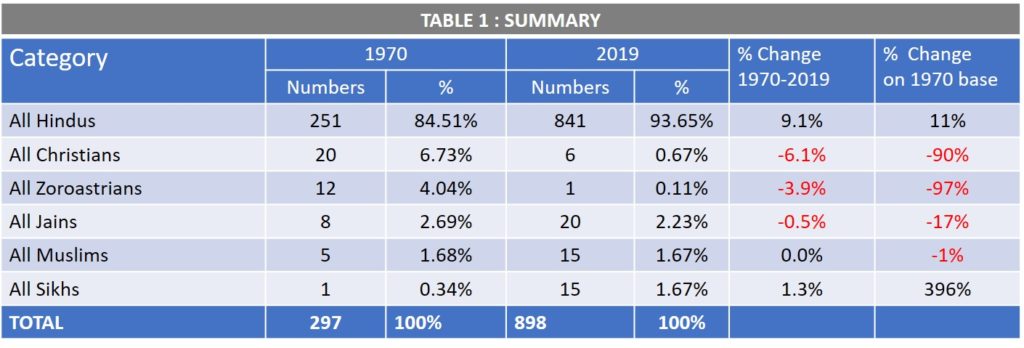
- Table 2 indicates the biggest drop in population occurred in the Zoroastrian Parsi/Irani category – from 4.05% in the 1970 class to 0.11% in the 2019 class. There are two reasons for that – the Zoroastrian community is a rapidly shrinking religious group in India with its population dropping from about 120,000 in 1970 to less than 65,000 in 2019. Also, the removal of English in the JEE ranking eliminated the advantage that this group had earlier in the mid-sixties to the early seventies.
- Although the Christian population in India remains the same at 2.3% in 1970 and in 2019, the percentage of Christians at IITB dropped from 6.73% in 1970 to 0.67% in 2019.
- On the surface, the Muslim student percentage looks like it has remained the same in 1970 @ 1.68% and at 1.67% in 2019. But, given India’s Muslim population – 13.4% in 1970 and 14.2% in 2019 – these figures reveal a drop in the Muslim student population as well.
- The Sikh population showed an increase in 2019 over 1970 to 1.67% vs 0.34% in 1970.
- The Jain student population has dropped from 2.69% in 1970 to 2.23% in 2019. This drop is statistically insignificant.
- The biggest increase in percent population occurred for Hindu students from 84.51% in 1970 to 93.65% in 2019. The main reason is the reservation of seats for SC, ST and OBC classes starting in the mid to late eighties. The percentage of all Hindus is far in excess of their proportion vis a vis other groups in the population in 2019.
- Of the increase in the Hindu student population, the largest has occurred in the HNo category. This can largely be attributed to IITB being perceived as the leading engineering school in the country.
- The popularity of engineering education and access to elite engineering institutions among women has been on the rise in India. This is clearly reflected in the 3,935% increase in the female population at IITB in 2019 over 1970.
